Section 1 – Introduction
Looking to analyze your product movements without using complex platforms?
You can do it directly in ChatGPT with a simple Excel or CSV file containing your product sales.
This guide helps you prepare your file and provides ready-to-use prompts for step-by-step analysis.
Section 2 – Prepare Your File
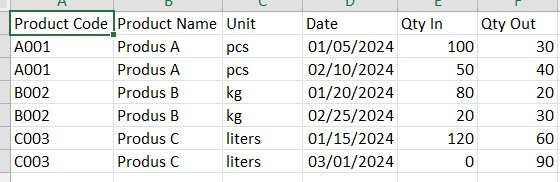
Your file must contain the following columns:
| Column Name | Description |
|---|---|
Product Code | Unique ID per product (e.g., A001) |
Product Name | Short description of the product |
Unit | Unit of measure (pcs, kg, liters, etc.) |
Date | Full date format: YYYY-MM-DD |
Qty In | Quantity received into stock |
Qty Out | Quantity sold or shipped out |
✅ Each row should represent a single transaction or daily summary per product.
✅ No stock values are needed — just movements.
✅ Make sure the file is sorted by Date.
🔷 Section 3 – Copy These Prompts into ChatGPT
After uploading your file to chat.openai.com, copy the prompts below and paste them one by one.
✅ File Preview & Validation
Please read the uploaded file and show me the first 5 rows.
Tell me how many rows there are and list the column names.
Check if there are any missing or invalid values.
📊 Total Sales per Product
Group total quantity out (Qty Out) by product name or code.
Sort the results in descending order and show the top 10 products.
📈 Monthly Sales Trend
Group total Qty Out by month based on the Date column.
Show a line chart of monthly sales volume.
🔄 Product Movement Summary
For each product, calculate:
- Total Qty In
- Total Qty Out
- Net Movement (Qty In - Qty Out)
Show the top 10 products with the highest net movement.
🧮 ABC Classification
Sort products by total Qty Out and classify them into:
- Class A: top 80% of volume
- Class B: next 15%
- Class C: bottom 5%
Display the result as a table only (no chart needed).
💤 Inactive Products
Which products had no Qty Out in the last 3 months?
List them by product code and name.
📄 Summary Report
Create a short report summarizing:
- Total number of products
- Top-selling products
- Monthly sales trend
- ABC classification
- Inactive products list
Export the report as a downloadable PDF.
🔷 Section 4 – Final Tips
- Upload your file first, then copy and paste the prompts one by one.
- You can modify the prompts to focus on specific products or time periods.
- If column names differ in your file, tell ChatGPT which columns to use.
💡 How to use these prompts
You can copy and use any of the prompts below in any order.
Each one works independently, so you can:
- explore total sales per product first,
- skip directly to ABC classification,
- or check inactive products — whatever suits your needs.
🔁 You don’t have to follow all prompts — use only what’s relevant to your case.
📄 The final report (PDF export) works best if you’ve run 2–3 insights beforehand.
✅ That’s it!
No setup. No subscriptions.
Just upload your file and let ChatGPT guide you through your sales data.
🧪 Try it yourself – Practice with a Test File
To help you feel confident using ChatGPT with your own sales data, we’ve created a sample file
you can download and explore freely.
📦 The file includes:
- 5 different products
- Inventory movements across two months
- Clear
Qty InandQty Outvalues to analyze
👉 You can use this file to:
- Practice the prompts listed above
- Understand how grouping, charts, or ABC classification works
- Test any other ideas or questions you have